Onchain Research
Role : Graphic Designer
Project : Visual Design, Research Report Series
Onchain publishes deep Web3 research from Zug: predictions, tokenization, token-launch guides and DeSoc studies read by the people building the decentralised internet. The brief for the report series was simple to say and hard to do: make dense findings feel premium and shareable. As Graphic Designer across the 2025 reports I built the visual layer that carries that research, an illustration language that turns each prediction into an object you can read in a second and want to repost.
2025
Ongoing series
Blender, Illustrator, Figma
Onchain
The brief always arrives before the article does: a topic, a prediction, a sector Onchain wants covered. The work starts with research, not rendering. What's the simplest visual idea that can hold something this dense? That direction goes back to stakeholders for sign-off before a single asset gets built. Once it's approved and the article itself is drafted, I build outward from the visual identity it sets: the 3D scene or diorama, the infographics translating its data, the cover and banner, the social campaign set, icons, mockups, and whatever interactive media the piece calls for. It's the same loop behind every report here, and the one behind the deeper 3D-scene studies in Onchain's motion work. One identity, built once per article, carried through every format the research has to travel in.
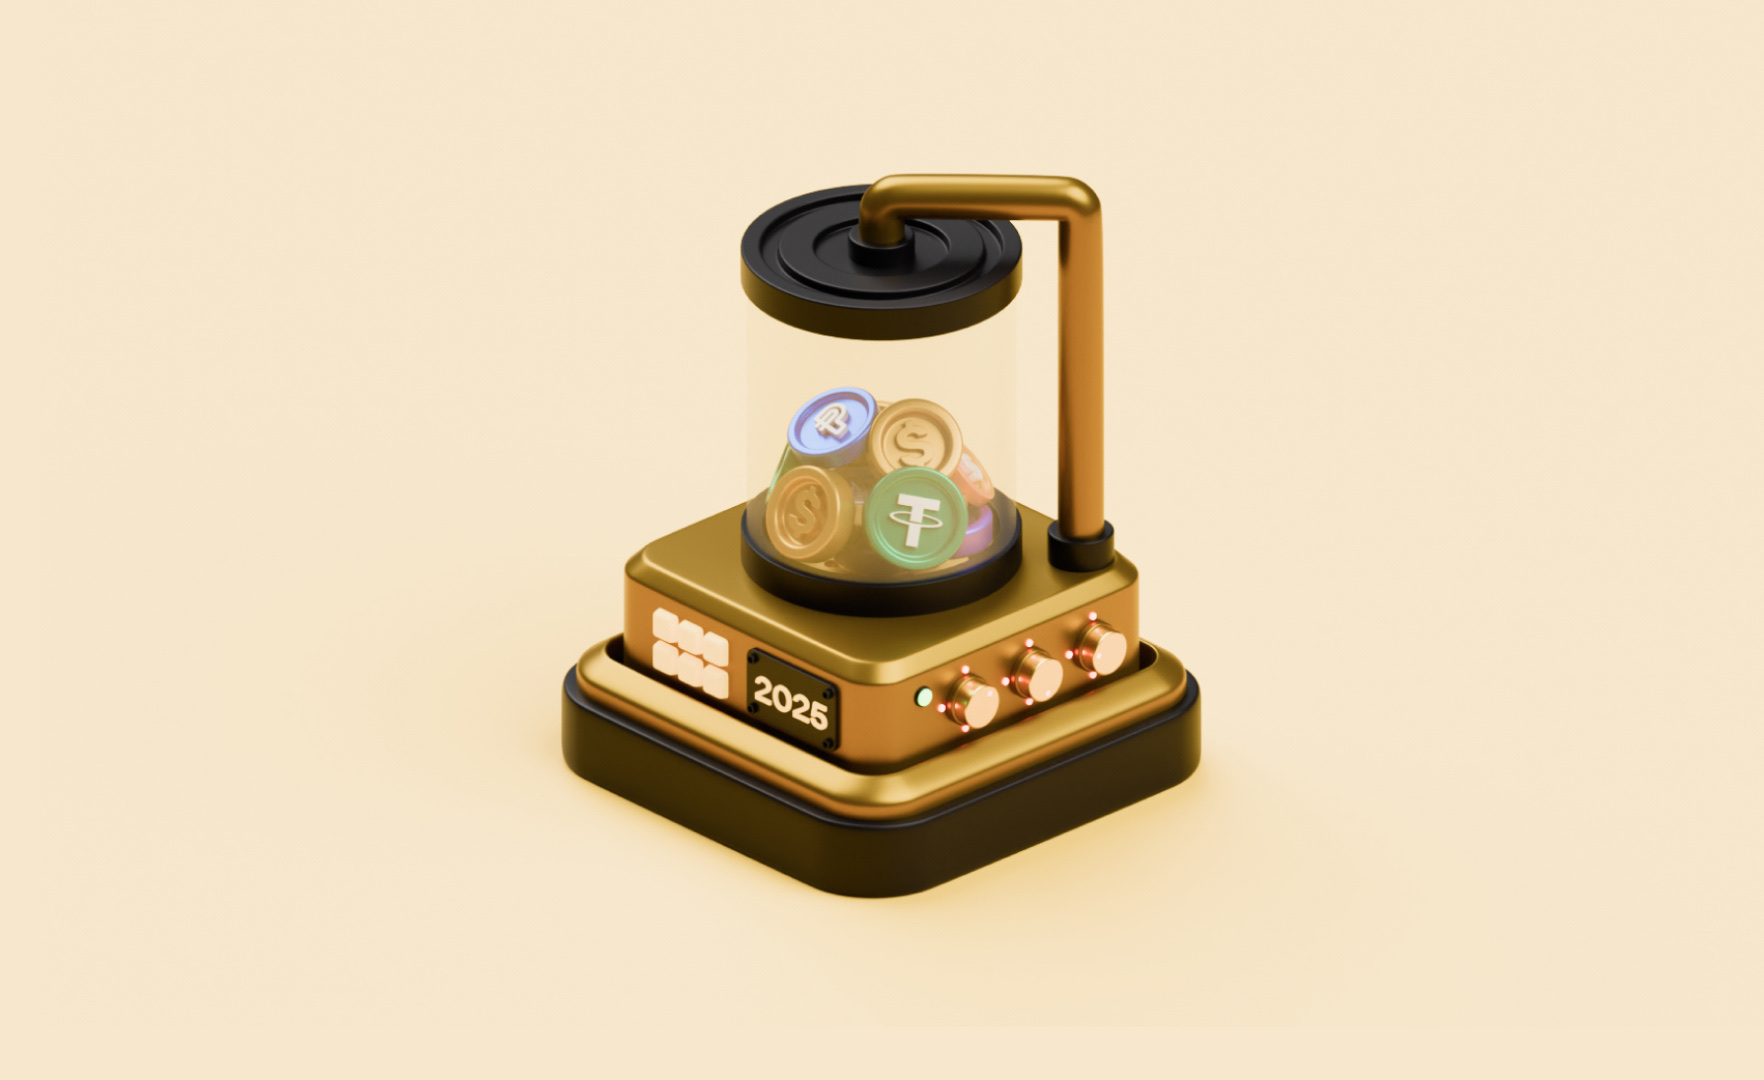
The system is one idea held with discipline: every prediction becomes a small machine. Each scene is a chunky isometric appliance, a rounded metal device with dials, vents and a glass dome, rendered in the same three-quarter view under the same soft studio light. The subject changes, the grammar never does: a golden orb-reactor for the year's outlook, a robot on a plinth for onchain AI agents, a coin press for smart apps. One camera, one material vocabulary, thirty-nine ways in.
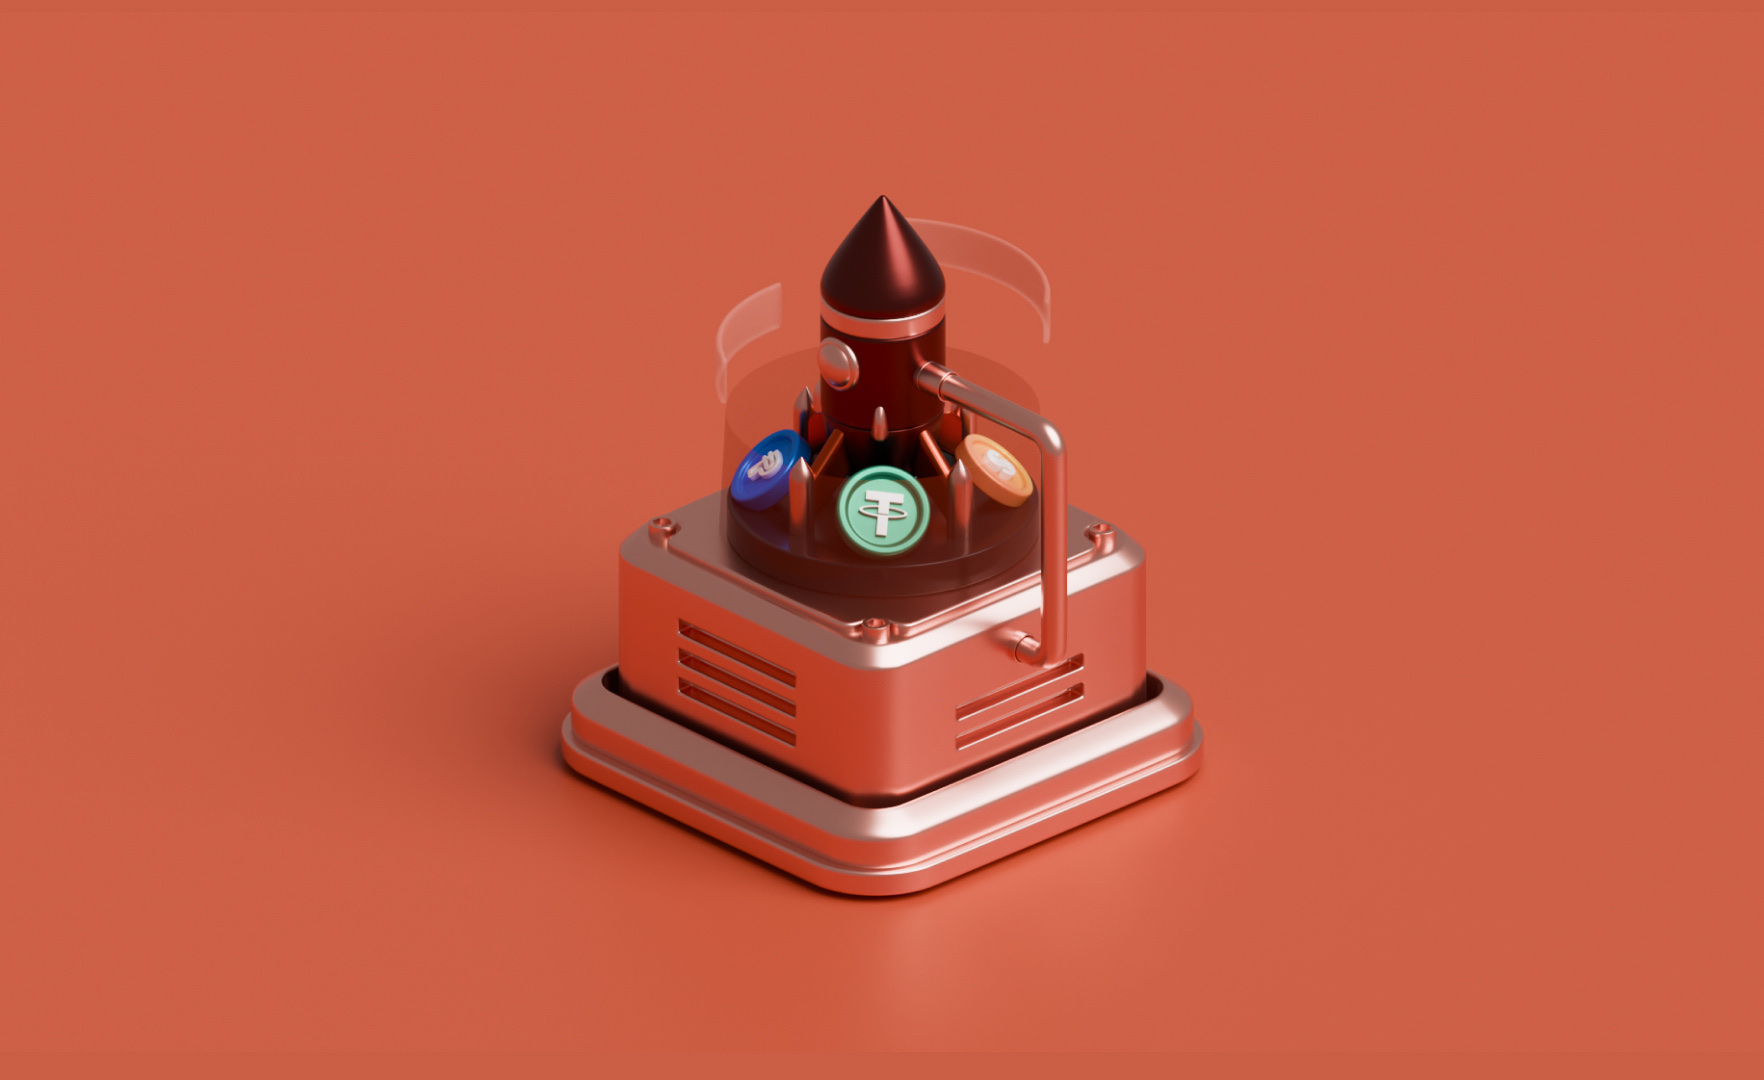
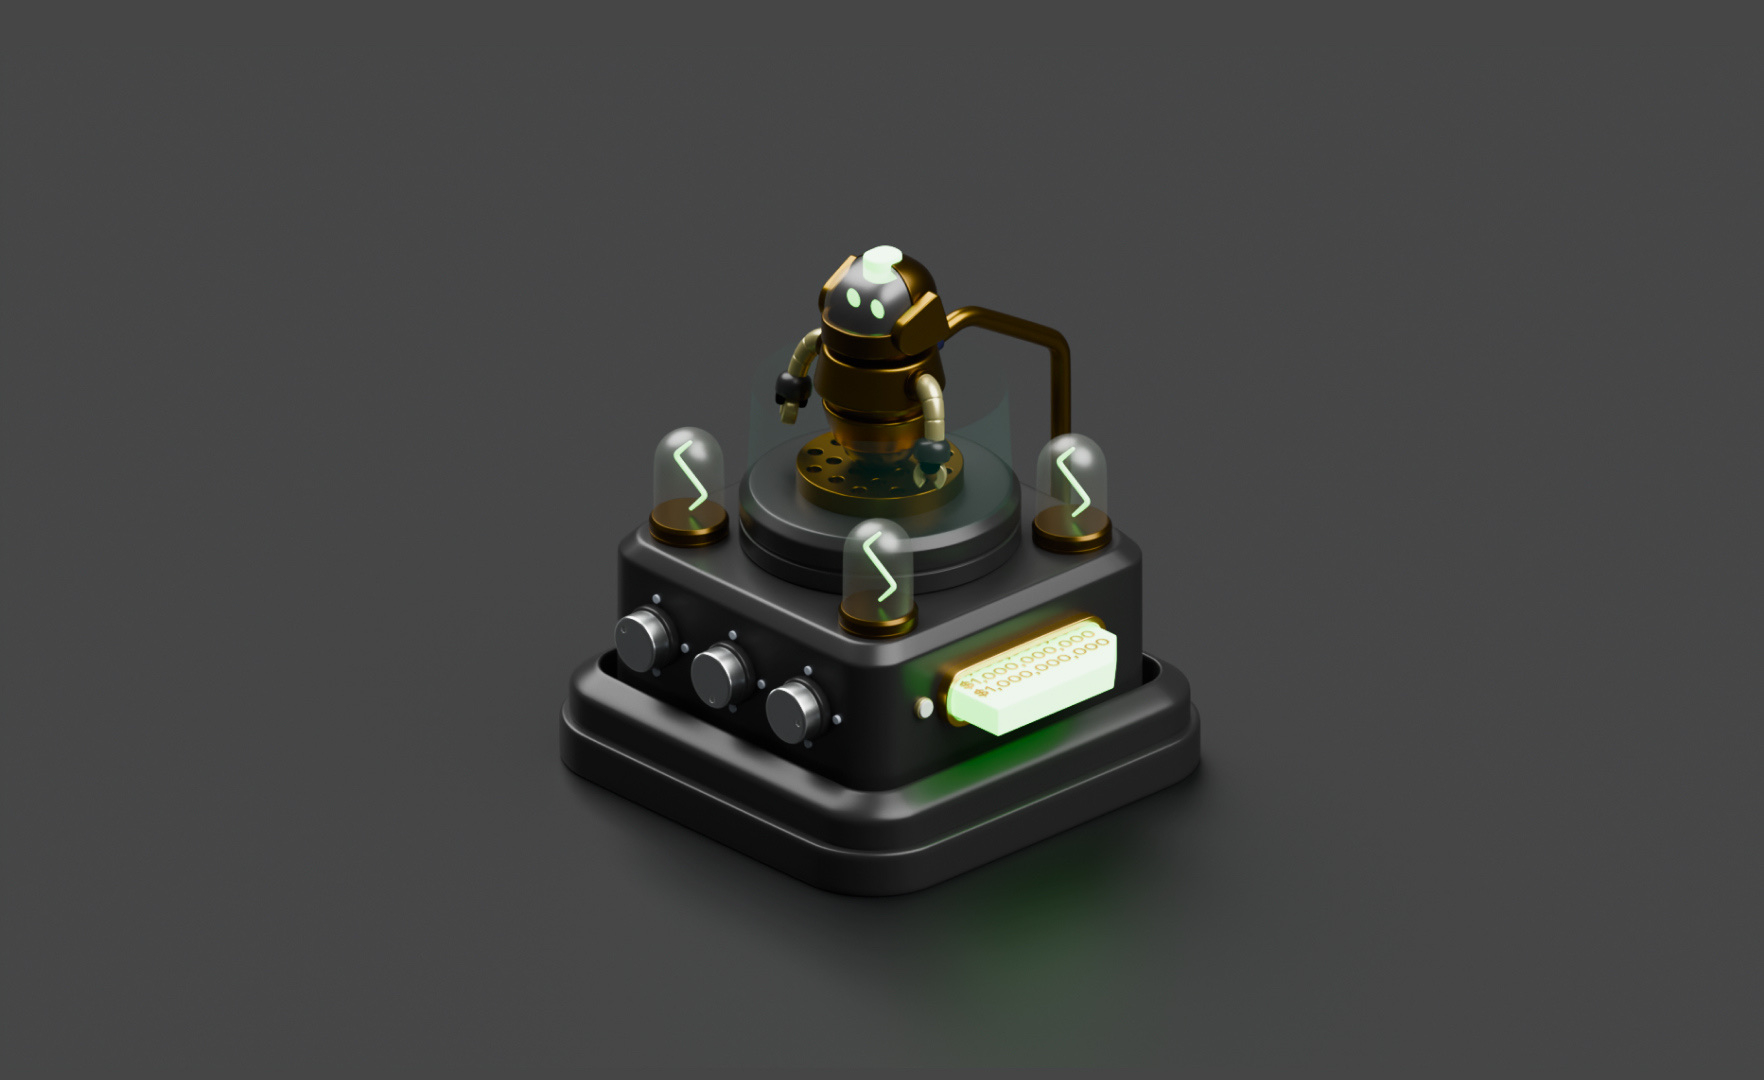
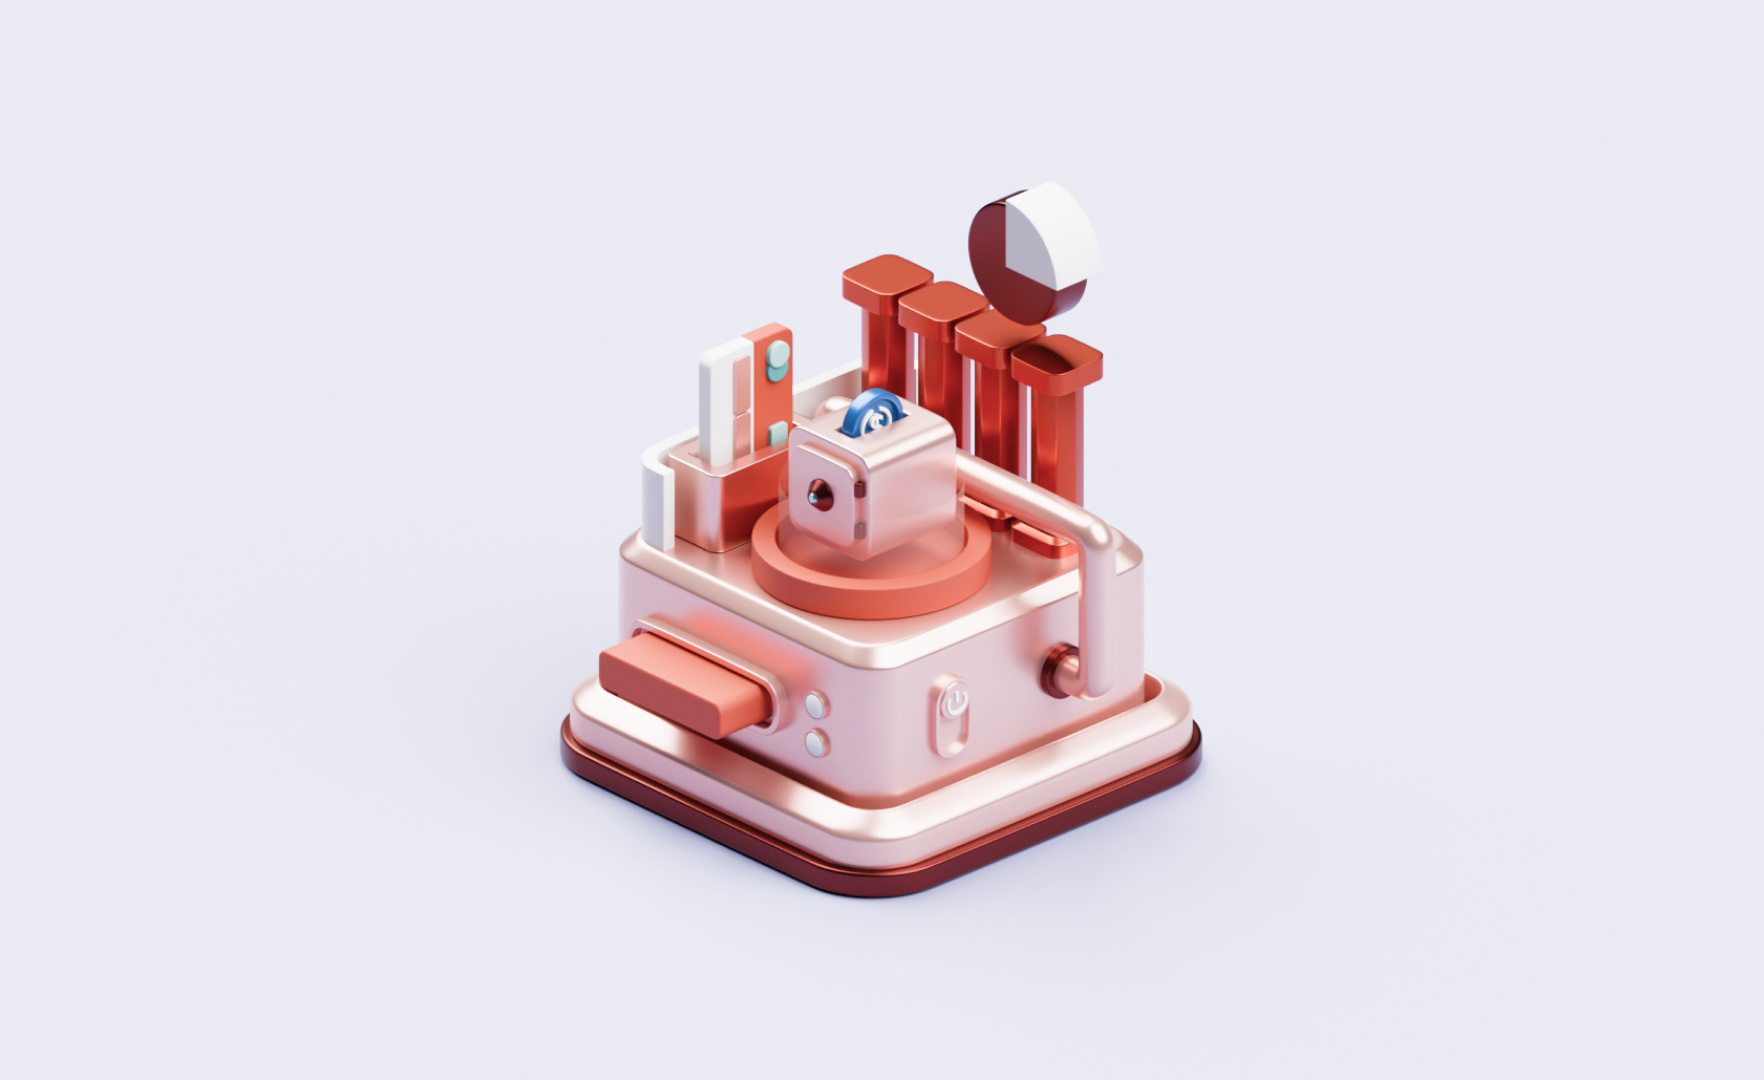
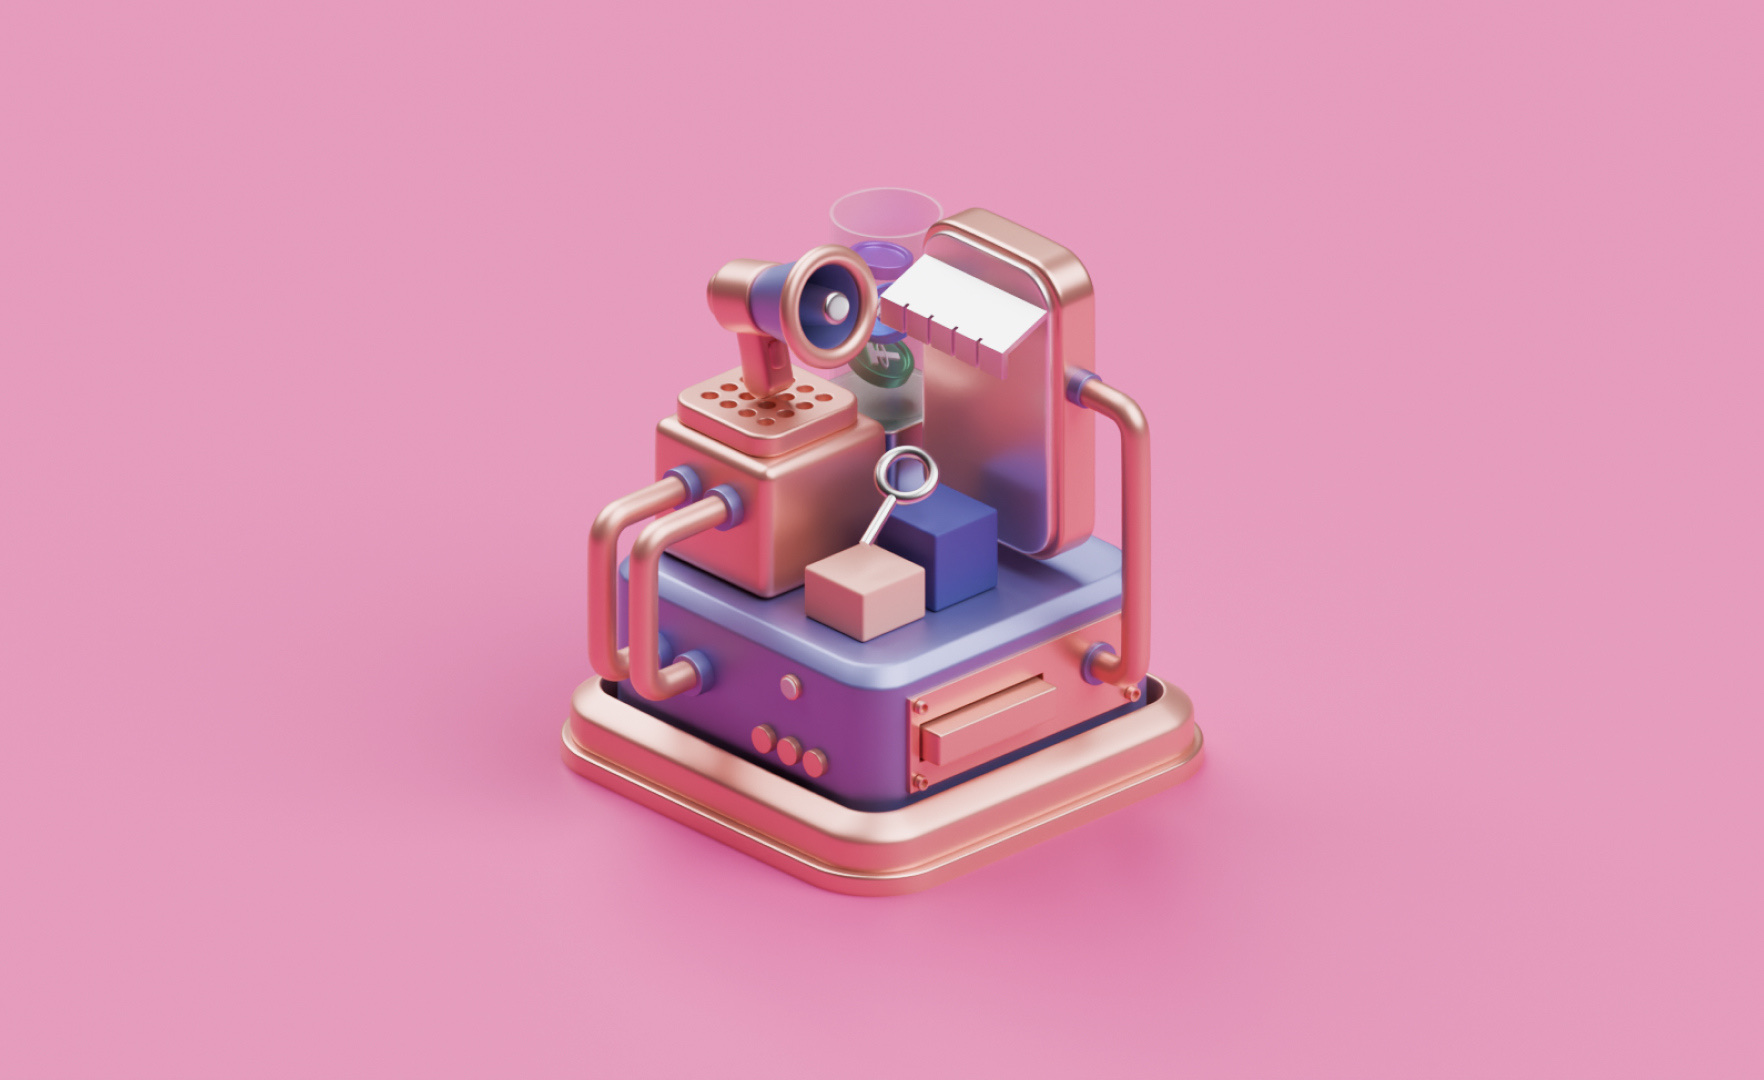
Because no two predictions are the same, no two dioramas are. Each is built bespoke: the NFT renaissance gets a rose-gold VR rig over a chessboard of tokens; modular blockchains stack into a cobalt-and-silver server; DePIN becomes a mint-green compute plant venting into a cloud. The shared construction keeps them a family across a long report, while the props and palette give every entry its own face on a feed.
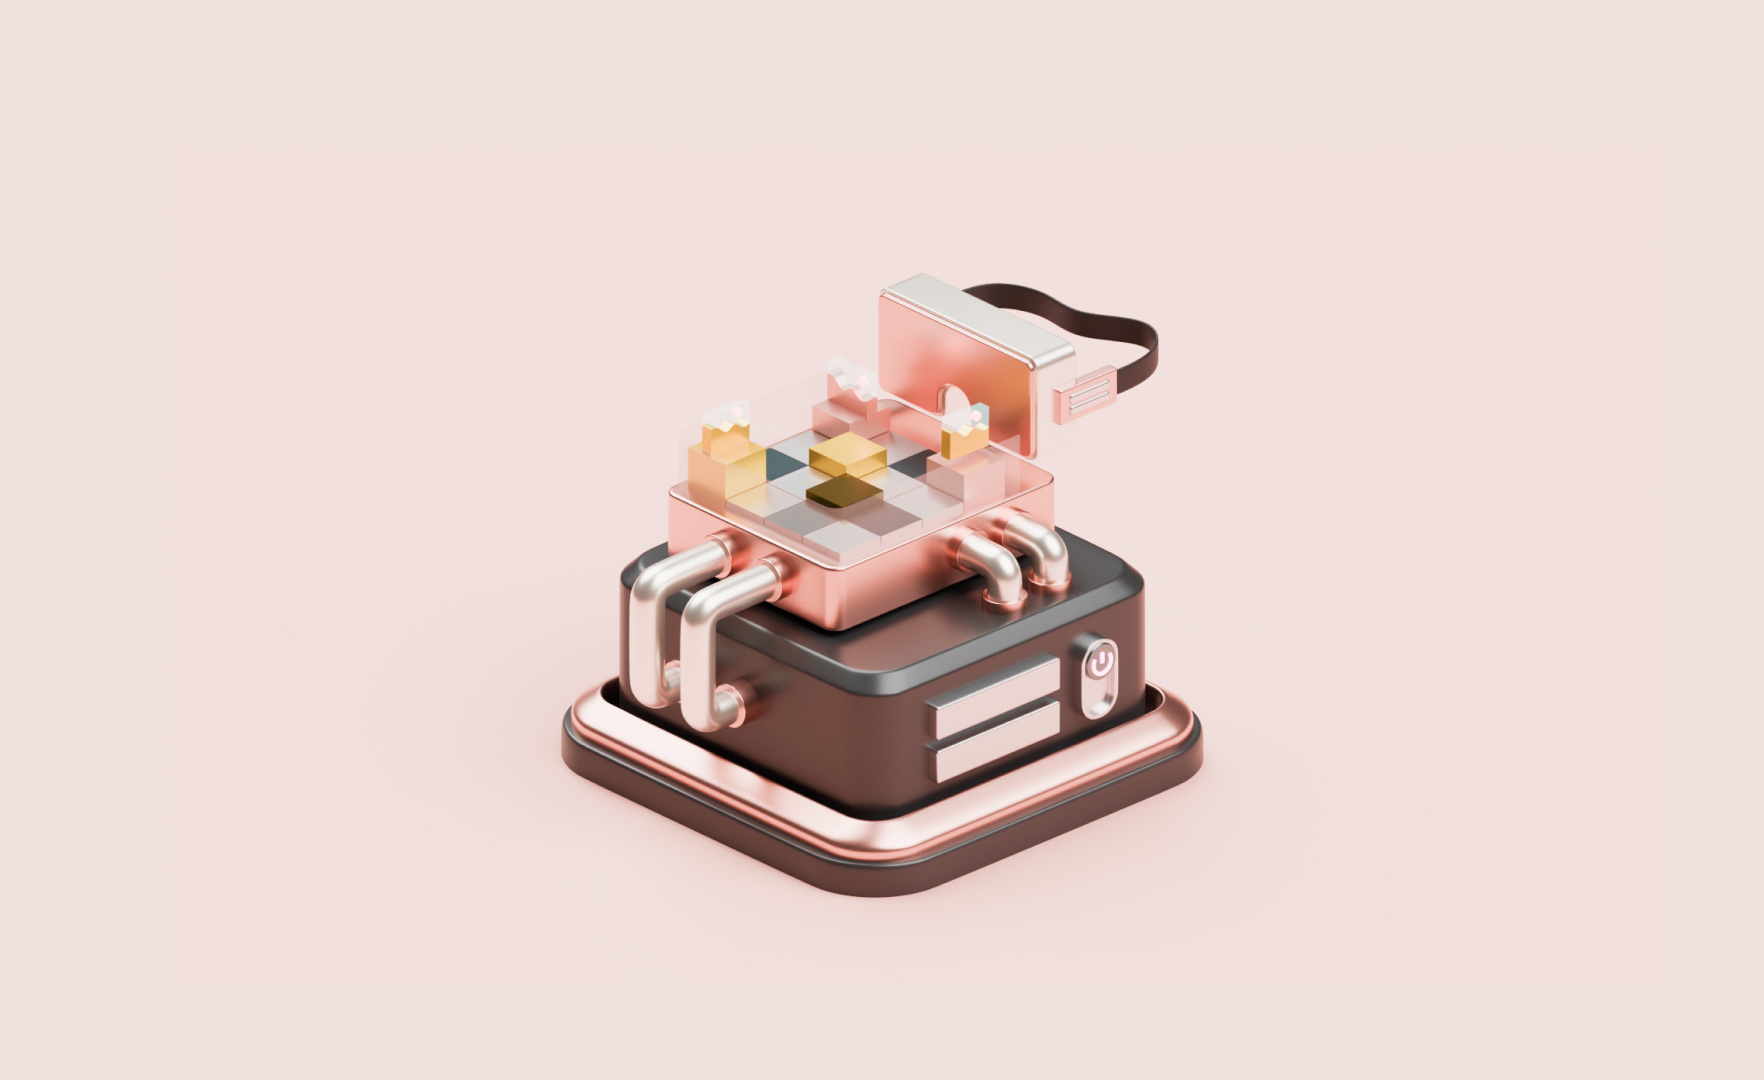
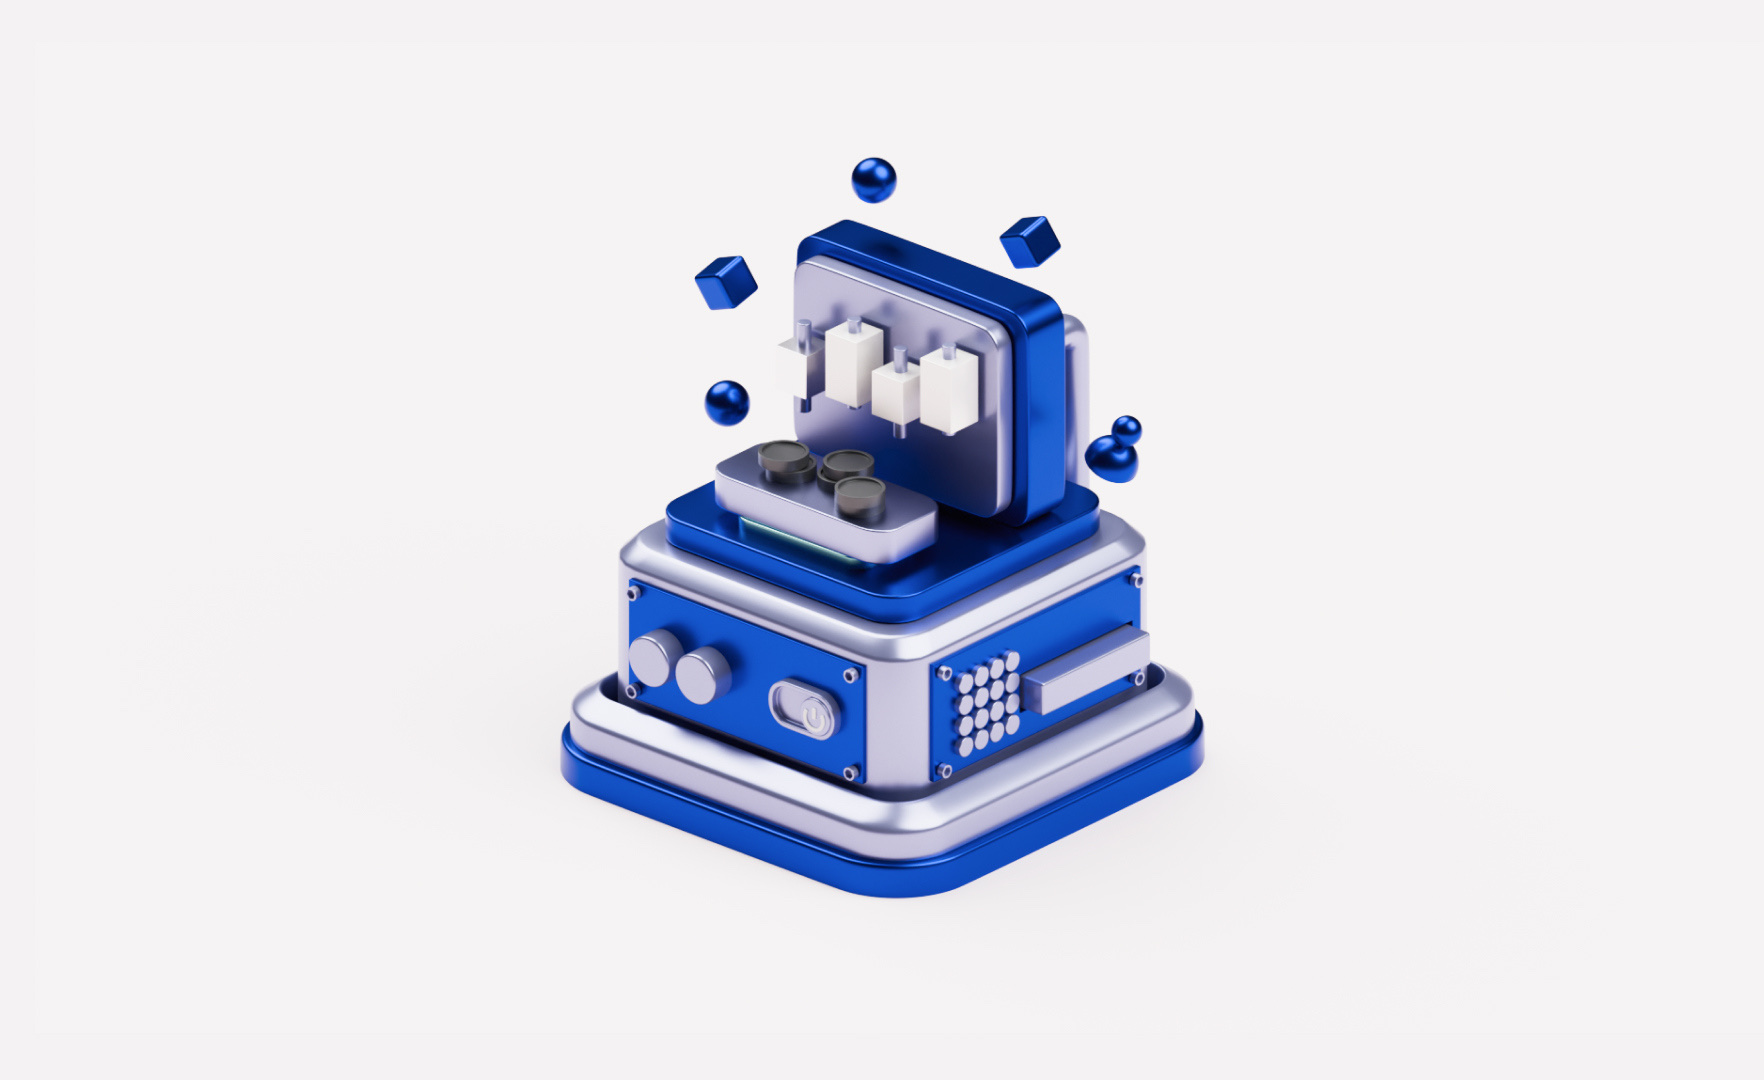

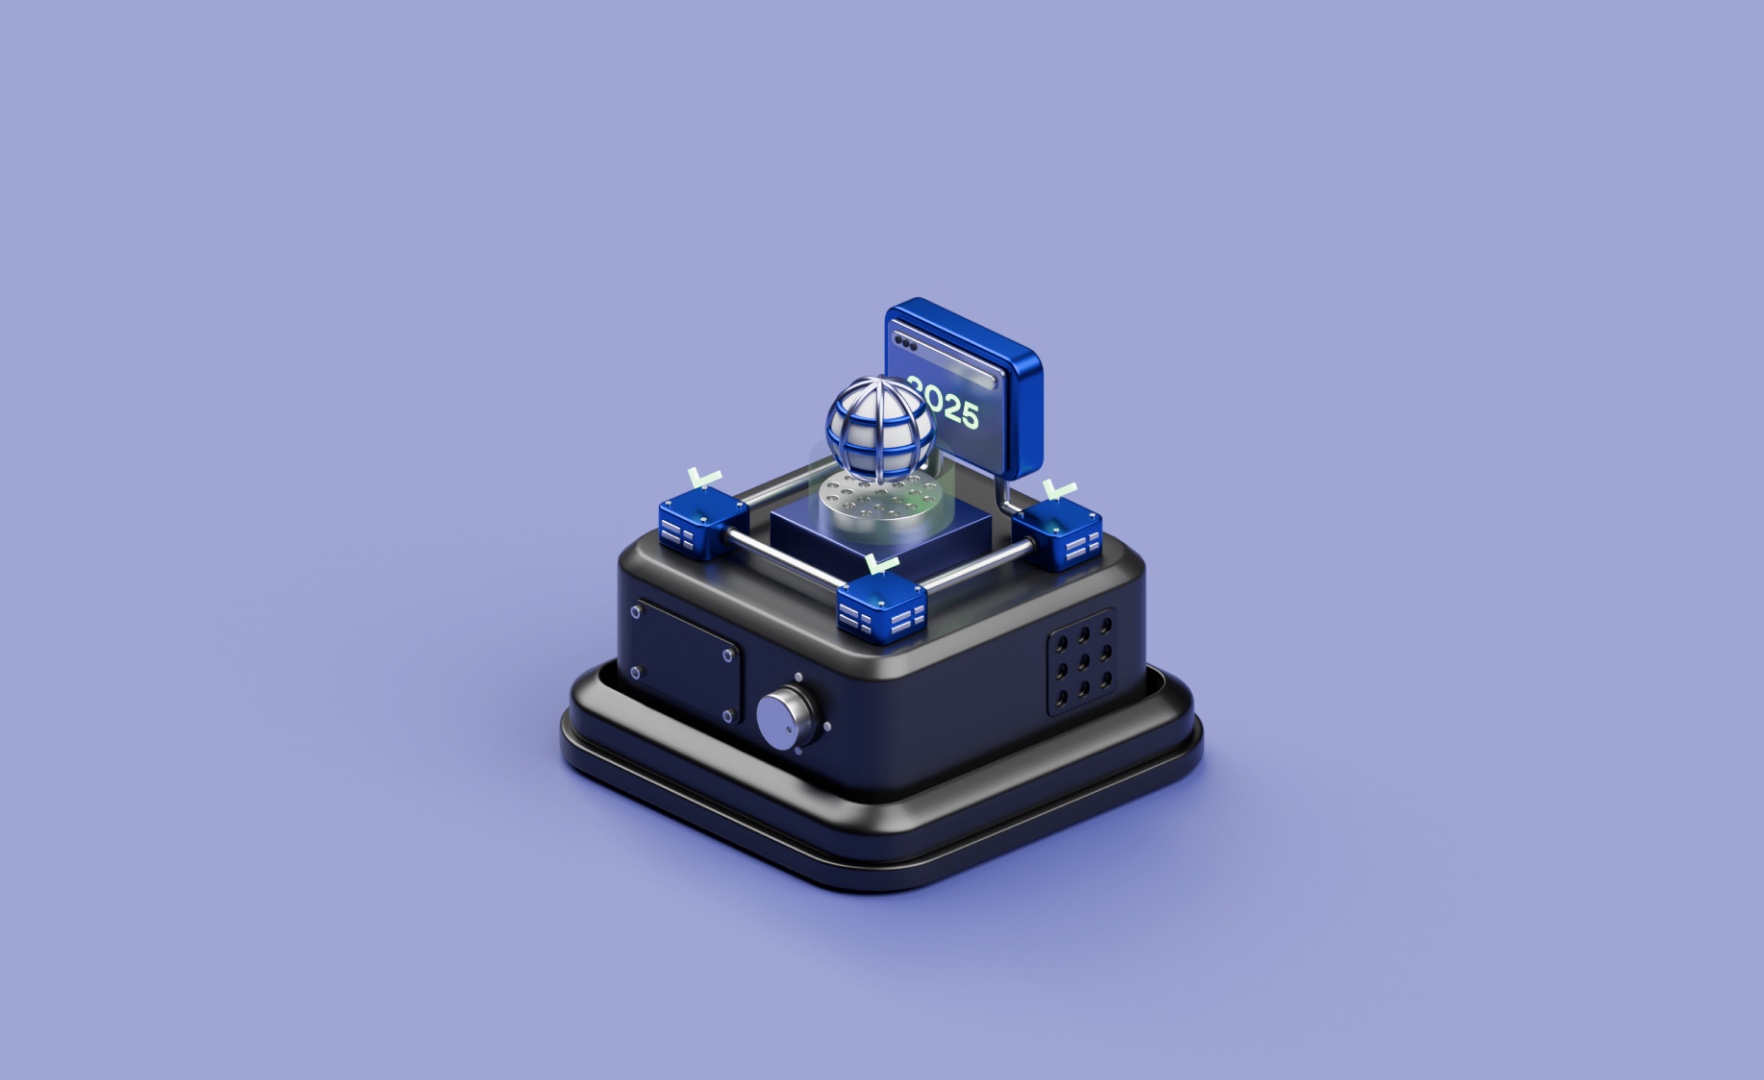
Colour is how the series stays legible at scale. Each topic owns a single vivid field: sand for stablecoins, blush for NFTs, mint for DePIN, terracotta for the growth outlook, charcoal for the cover. A reader learns a section by its background before they read a word. The device sits alone on that flat field, metallic and warm-lit, which lets the same illustration work as a report cover, a section head and a social card without a single crop fighting the composition.
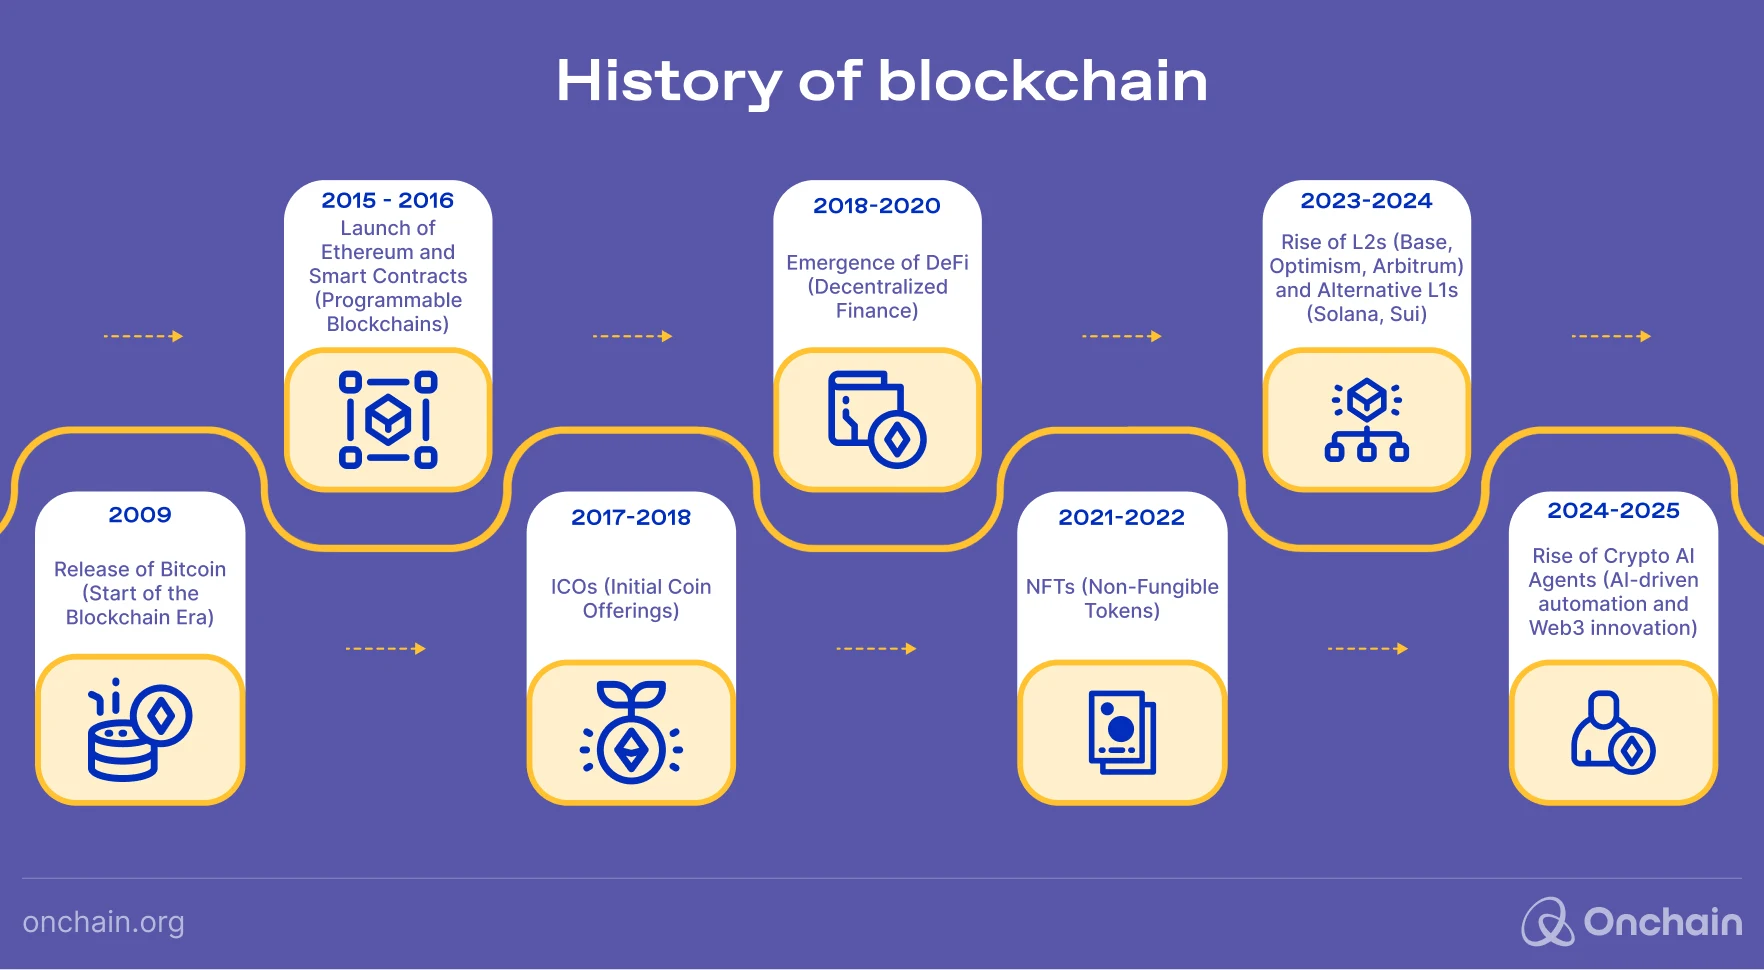
On the page the illustrations anchor a fixed architecture: a full-bleed cover diorama, then prediction cards that pair each scene with its thesis, a methodology note, and a contributor grid of the thought leaders on record. The layout is built to let the artwork lead and the research follow. Alongside the dioramas runs a second visual language, the data itself: charts, flywheels and sector maps that turn the report's findings into figures you can read at a glance.
Research that reads like a product, not a PDF.
The illustration system shipped across Onchain's 2025 research: the 39-prediction Web3 report, plus the Tokenization, Token Launch Guide and DeSoc studies, carrying findings from thought leaders like Stacy Muur, Jesse Pollak of Base and Franklin Templeton's Jenny Johnson. One diorama language gave a dense research series a face the audience recognises at a glance and shares on sight, published on onchain.org and adding to the platform's standing in blockchain research.
Read "39 Web3 Predictions for 2025" on onchain.org ↗